
Forum
»
Consumers holding strong - Retail sales be expectations
- Results 1 to 23 of 23
-
Page 1 of 1
 04-05-2026, 03:25 PM
-
#1

- gachase21
- Join Date: Dec 2010
- Location: Georgia, United States
- Posts: 31,767
- Subscribers: 4
- Rep Power: 389233
-
-

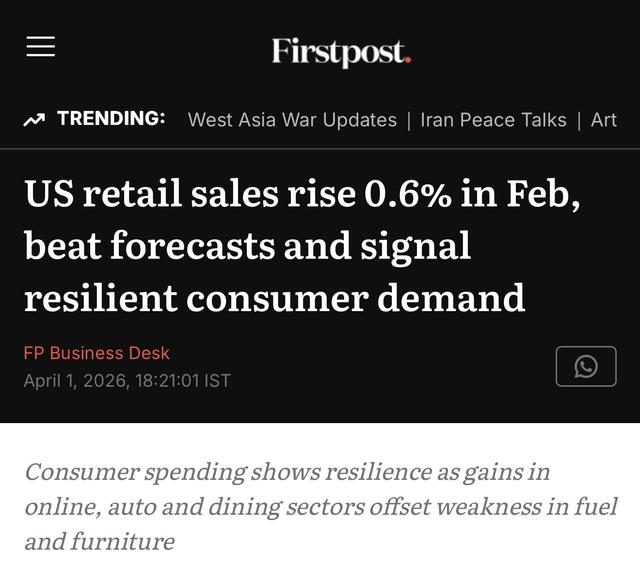
Consumers holding strong - Retail sales be expectations
Retail sales beat expectations
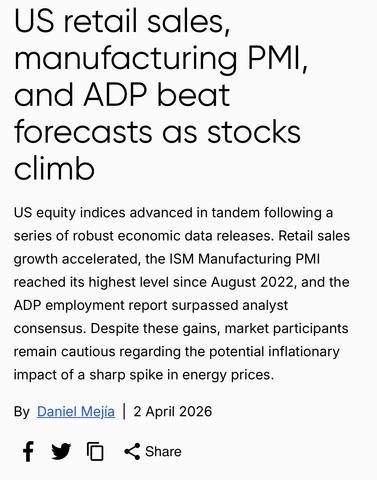
Some other good news on our strong economy
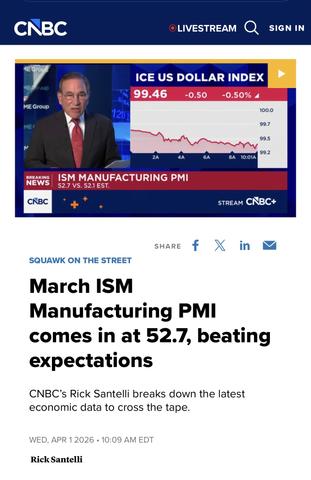
And
Ism manufacturing PMI beat expectations
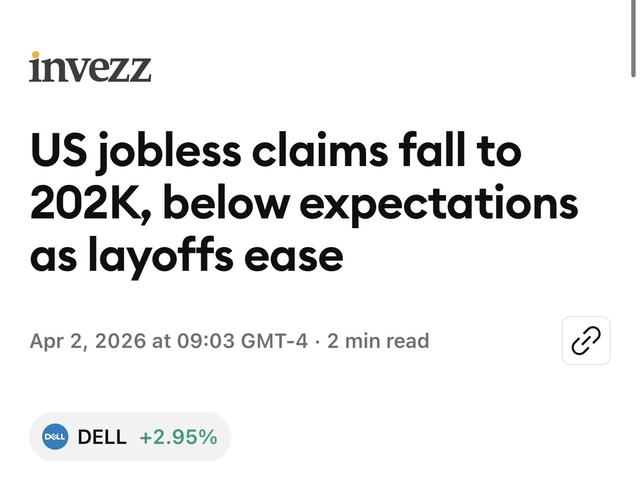
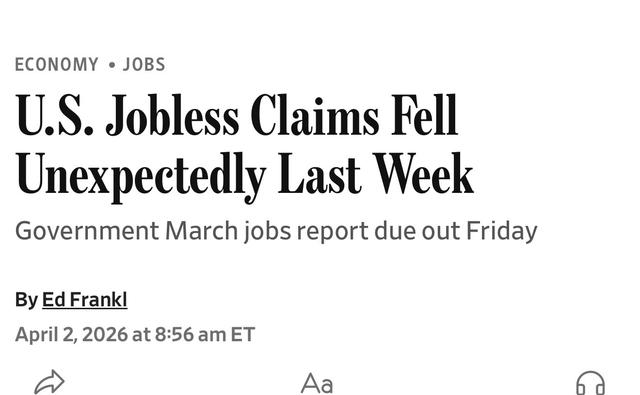
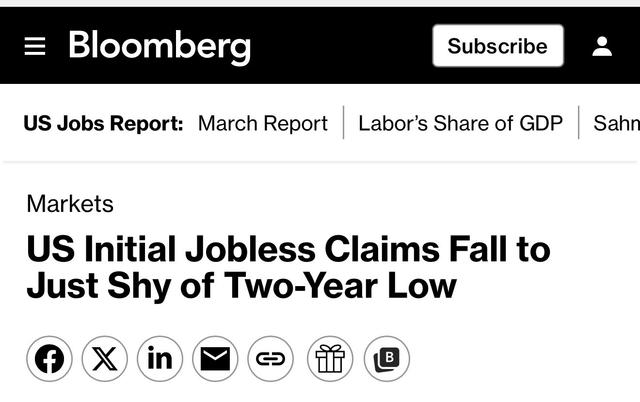
Also Jobless claims came in less than expected
Let's keep it up!!!
Some other good news on our strong economy
And
Ism manufacturing PMI beat expectations
Also Jobless claims came in less than expected
Let's keep it up!!!
04-05-2026, 04:04 PM
-
#2

Top 10% of earners drive 50% of consumption.
Top 10% of Earners Drive a Growing Share of US Consumer Spending
https://www.bloomberg.com/news/articles/2025-09-16/top-10-of-earners-drive-a-growing-share-of-us-consumer-spending?embedded-checkout=true
The U.S. Economy Depends More Than Ever on Rich People
https://www.wsj.com/economy/consumers/us-economy-strength-rich-spending-2c34a571?gaa_at=eafs&gaa_n=AWEtsqdIF2tEfQtTbQFwi-zqfsw5Jer3jyVJiOhiGc86nU_XSgd7czP9MCxJ&gaa_ts=69d2df59&gaa_sig=g5hp0gfSCrF4xYsR7dEN0ZSUZuEt77sLgqXg9hEyJ-AuEWwBukiBmlmNtejT-ZgceXsUAwVzlDtkXnXya-BOfA%3D%3D
Top 10% of Earners Drive a Growing Share of US Consumer Spending
https://www.bloomberg.com/news/articles/2025-09-16/top-10-of-earners-drive-a-growing-share-of-us-consumer-spending?embedded-checkout=true
The U.S. Economy Depends More Than Ever on Rich People
https://www.wsj.com/economy/consumers/us-economy-strength-rich-spending-2c34a571?gaa_at=eafs&gaa_n=AWEtsqdIF2tEfQtTbQFwi-zqfsw5Jer3jyVJiOhiGc86nU_XSgd7czP9MCxJ&gaa_ts=69d2df59&gaa_sig=g5hp0gfSCrF4xYsR7dEN0ZSUZuEt77sLgqXg9hEyJ-AuEWwBukiBmlmNtejT-ZgceXsUAwVzlDtkXnXya-BOfA%3D%3D
"I am a rational animal who occupies the intermediary position between angel and beast"
"The upper class is afforded their position by the collective burden the underclass must carry for them"
**Summer Walker Crew**
04-05-2026, 04:23 PM
-
#3
04-05-2026, 04:37 PM
-
#4
- Stizzel
- Rothbardian
-

- Stizzel
- Rothbardian
- Join Date: Apr 2008
- Location: Your Mom
- Posts: 83,746
- Subscribers: 1
- Rep Power: 384419
-
-

Yes keep telling the plebs how great the economy is and if they're struggling they must be stupid. I cant imagine how this could backfire
“It’s the bill of rights, not the bill of requests. Rights are not up for negotiations.” Thomas Massie, MAGA enemy #1
04-05-2026, 04:51 PM
-
#5

- isingm0del
- Join Date: Mar, 2026
- Posts: 19
- Rep Power: 0
-
-
It's quite telling that the three remaining MIGAs here are
Mark1T a bonafide child rape advocate
Gachase who is severely brain damaged IRL and can't tell up from down
Waingro who has never left his mother's basement
Everyone else has actually moved on lol
Absolutely brootal
Mark1T a bonafide child rape advocate
Gachase who is severely brain damaged IRL and can't tell up from down
Waingro who has never left his mother's basement
Everyone else has actually moved on lol
Absolutely brootal
04-05-2026, 04:53 PM
-
#6
Originally Posted By Stizzel⏩
Just keep listening to Bloomberg lol.
Yes keep telling the plebs how great the economy is and if they're struggling they must be stupid. I cant imagine how this could backfire
There are 100k jobs everywhere, and we're in the golden age of prosperity for all!
Just look around. And you if see something different, don't believe your eyes.
Just reference to Bloomberg.
Originally Posted By isingm0del⏩
So accurate lol.
It's quite telling that the three remaining MIGAs here are
Mark1T a bonafide child rape advocate
Gachase who is severely brain damaged IRL and can't tell up from down
Waingro who has never left his mother's basement
Everyone else has actually moved on lol
Absolutely brootal
Mark1T a bonafide child rape advocate
Gachase who is severely brain damaged IRL and can't tell up from down
Waingro who has never left his mother's basement
Everyone else has actually moved on lol
Absolutely brootal
"I am a rational animal who occupies the intermediary position between angel and beast"
"The upper class is afforded their position by the collective burden the underclass must carry for them"
**Summer Walker Crew**
04-05-2026, 04:55 PM
-
#7
 04-05-2026, 05:06 PM
-
#8
- gachase21
- Join Date: Dec 2010
- Location: Georgia, United States
- Posts: 31,767
- Subscribers: 4
- Rep Power: 389233
-
-
Originally Posted By OPGenesis⏩
Allot of this is K shaped arguments- which may have some validity- however they may not as much as people think.
Top 10% of earners drive 50% of consumption.
Top 10% of Earners Drive a Growing Share of US Consumer Spending
https://www.bloomberg.com/news/articles/2025-09-16/top-10-of-earners-drive-a-growing-share-of-us-consumer-spending?embedded-checkout=true
The U.S. Economy Depends More Than Ever on Rich People
https://www.wsj.com/economy/consumers/us-economy-strength-rich-spending-2c34a571?gaa_at=eafs&gaa_n=AWEtsqdIF2tEfQtTbQFwi-zqfsw5Jer3jyVJiOhiGc86nU_XSgd7czP9MCxJ&gaa_ts=69d2df59&gaa_sig=g5hp0gfSCrF4xYsR7dEN0ZSUZuEt77sLgqXg9hEyJ-AuEWwBukiBmlmNtejT-ZgceXsUAwVzlDtkXnXya-BOfA%3D%3D
Top 10% of Earners Drive a Growing Share of US Consumer Spending
https://www.bloomberg.com/news/articles/2025-09-16/top-10-of-earners-drive-a-growing-share-of-us-consumer-spending?embedded-checkout=true
The U.S. Economy Depends More Than Ever on Rich People
https://www.wsj.com/economy/consumers/us-economy-strength-rich-spending-2c34a571?gaa_at=eafs&gaa_n=AWEtsqdIF2tEfQtTbQFwi-zqfsw5Jer3jyVJiOhiGc86nU_XSgd7czP9MCxJ&gaa_ts=69d2df59&gaa_sig=g5hp0gfSCrF4xYsR7dEN0ZSUZuEt77sLgqXg9hEyJ-AuEWwBukiBmlmNtejT-ZgceXsUAwVzlDtkXnXya-BOfA%3D%3D
First of- year high earners drive spending- but they doesn't really mean lower earners aren't increasing- nor just because someone is doing better doesn't mean you are not doing good. You have to watch for wealth envy in some takes
regardless...
Have U.S. consumers gone “K-shaped”? A review of the data
The term “K-shaped economy” arose after the COVID-19
pandemic to characterize the diverging economic paths of high-income Americans
and everyone else. It became ubiquitous in 2025, one of the “biggest business
buzzwords” of the year
Growing U.S. inequality in income and wealth is not a new phenomenon. But the recent K-shaped story is often told in terms of consumption
growth—of rich shoppers powering the economy with their spending while others
pull back. Retailers remark on their bifurcated customer base; airlines and
hotels tout the boom in their premium fares and luxury hotel brands.
Like the contemporaneous assertion of an American “vibecession,” the conventional wisdom around the K-shaped economy has depended heavily on such anecdotes. Beyond the vibe, what case do the available data sources make for K-shaped consumption? Comparing available measures is much like setting proverbial apples and oranges next to one another. But the overall
picture is more complicated than the media headlines suggest.
Moody’s: K-shaped in a big way (but with skeptics)
The credit-rating agency Moody’s Analytics shares its
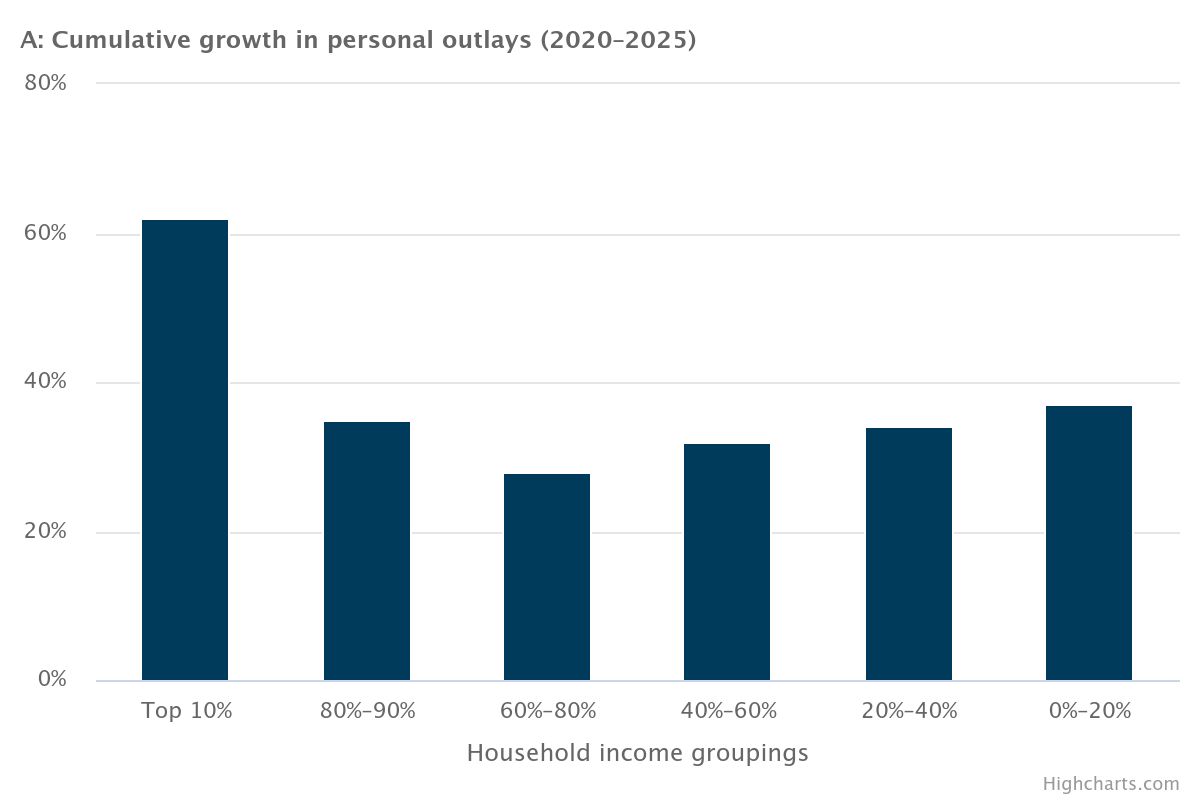
proprietary analysis primarily via social media and financial news outlets. Moody’s calculates a steep, K-shaped spike in spending growth by the top 10 percent of households (by income) starting in 2020. In early 2026 via The Washington Post, Moody’s reported that spending by the top 10 percent grew 62
percent between third quarter 2020 and third quarter 2025, much more than any other income group (Figure 1A).
Note: Q3-2020 to Q3-2025, based on 4-quarter moving average
of nominal personal outlays remaining after calculated household savings for
each income group.
Source: Moody's Analytics via The Washington Post, applying
Federal Reserve data.
For the most recent 12 months, spending by these top earners
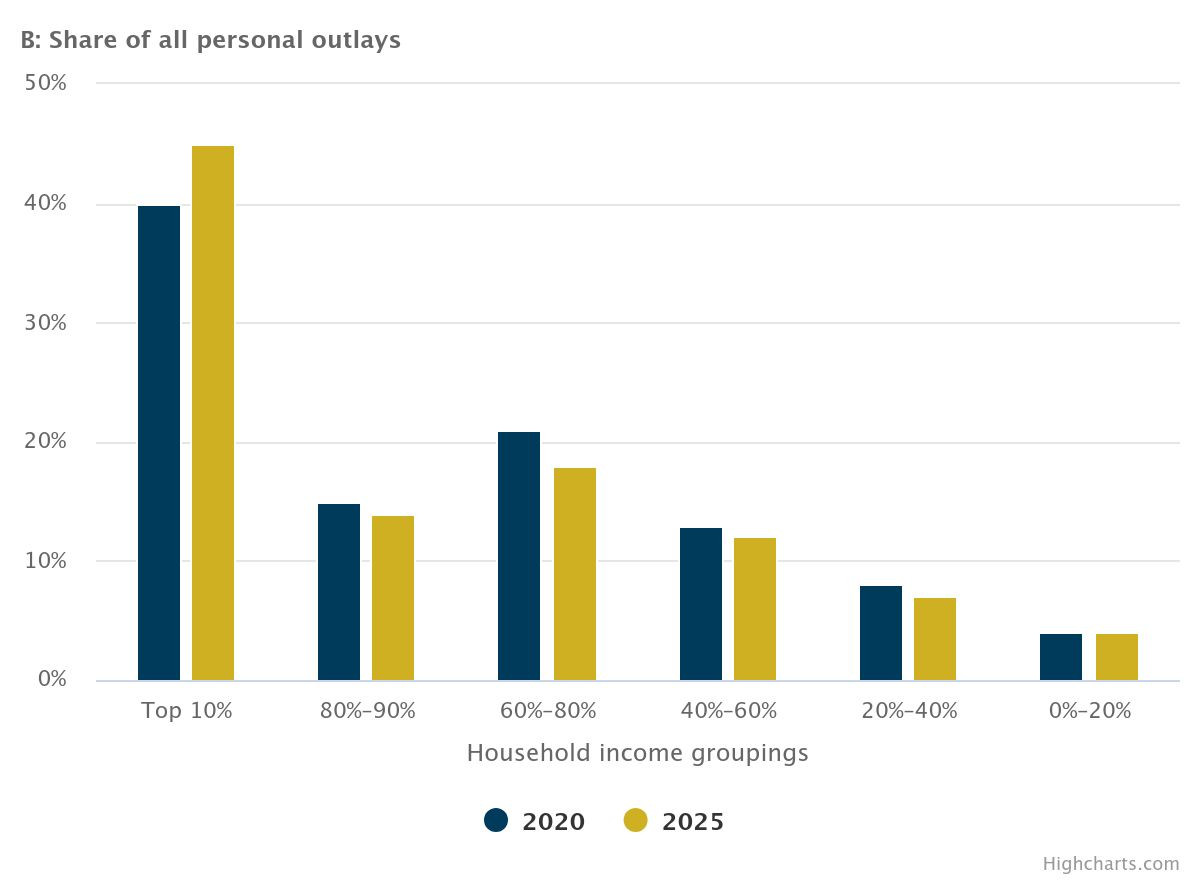
grew more than 4 percent in nominal terms; growth for all other groupings in 2025 was close to 3 percent. These households, Moody’s says, now account for more than 45 percent of spending while the bottom 60 percent of households comprise just 23 percent of spending (Figure 1B).
Each prior update from Moody’s garnered headlines through
2025, although the methodology and stark findings have drawn skeptics. It is not a direct measure of consumption expenditures by households. Rather, Moody’s works backward from financial and wealth data to estimate the average household savings for each income grouping.1 They count whatever disposable income
remains—technically, “personal outlays”— as a broad measure of spending.
Critics argue that the concentration of spending among the
top 10 percent is implausible, and that converting macroeconomic data on financial asset flows to a measure of household spending makes improper assumptions. Nonetheless, the findings remain a well-publicized data point in media coverage, staking out the upper bound of the K-shaped consumption story.
To be cont....The term “K-shaped economy” arose after the COVID-19
pandemic to characterize the diverging economic paths of high-income Americans
and everyone else. It became ubiquitous in 2025, one of the “biggest business
buzzwords” of the year
Growing U.S. inequality in income and wealth is not a new phenomenon. But the recent K-shaped story is often told in terms of consumption
growth—of rich shoppers powering the economy with their spending while others
pull back. Retailers remark on their bifurcated customer base; airlines and
hotels tout the boom in their premium fares and luxury hotel brands.
Like the contemporaneous assertion of an American “vibecession,” the conventional wisdom around the K-shaped economy has depended heavily on such anecdotes. Beyond the vibe, what case do the available data sources make for K-shaped consumption? Comparing available measures is much like setting proverbial apples and oranges next to one another. But the overall
picture is more complicated than the media headlines suggest.
Moody’s: K-shaped in a big way (but with skeptics)
The credit-rating agency Moody’s Analytics shares its
proprietary analysis primarily via social media and financial news outlets. Moody’s calculates a steep, K-shaped spike in spending growth by the top 10 percent of households (by income) starting in 2020. In early 2026 via The Washington Post, Moody’s reported that spending by the top 10 percent grew 62
percent between third quarter 2020 and third quarter 2025, much more than any other income group (Figure 1A).
Note: Q3-2020 to Q3-2025, based on 4-quarter moving average
of nominal personal outlays remaining after calculated household savings for
each income group.
Source: Moody's Analytics via The Washington Post, applying
Federal Reserve data.
For the most recent 12 months, spending by these top earners
grew more than 4 percent in nominal terms; growth for all other groupings in 2025 was close to 3 percent. These households, Moody’s says, now account for more than 45 percent of spending while the bottom 60 percent of households comprise just 23 percent of spending (Figure 1B).
Each prior update from Moody’s garnered headlines through
2025, although the methodology and stark findings have drawn skeptics. It is not a direct measure of consumption expenditures by households. Rather, Moody’s works backward from financial and wealth data to estimate the average household savings for each income grouping.1 They count whatever disposable income
remains—technically, “personal outlays”— as a broad measure of spending.
Critics argue that the concentration of spending among the
top 10 percent is implausible, and that converting macroeconomic data on financial asset flows to a measure of household spending makes improper assumptions. Nonetheless, the findings remain a well-publicized data point in media coverage, staking out the upper bound of the K-shaped consumption story.
04-05-2026, 05:06 PM
-
#9
- gachase21
- Join Date: Dec 2010
- Location: Georgia, United States
- Posts: 31,767
- Subscribers: 4
- Rep Power: 389233
-
-
CONT.....
Bank of America: More recent, and more E-shaped than
K-shaped
Another private sector report, Consumer Checkpoint from the Bank of America Institute, began including summaries of spending growth by
income in late 2024. The monthly report provides a near-real-time view, albeit
limited to credit and debit card spending by Bank of America customers.3
While Moody’s pegs a sharp break after 2020, Bank of America
did not observe a widening gap in their data until mid-2025, when a large
separation in spending growth opened between lower-, middle-, and upper-income
customers—arguably more “E” than “K” (Figure 2).
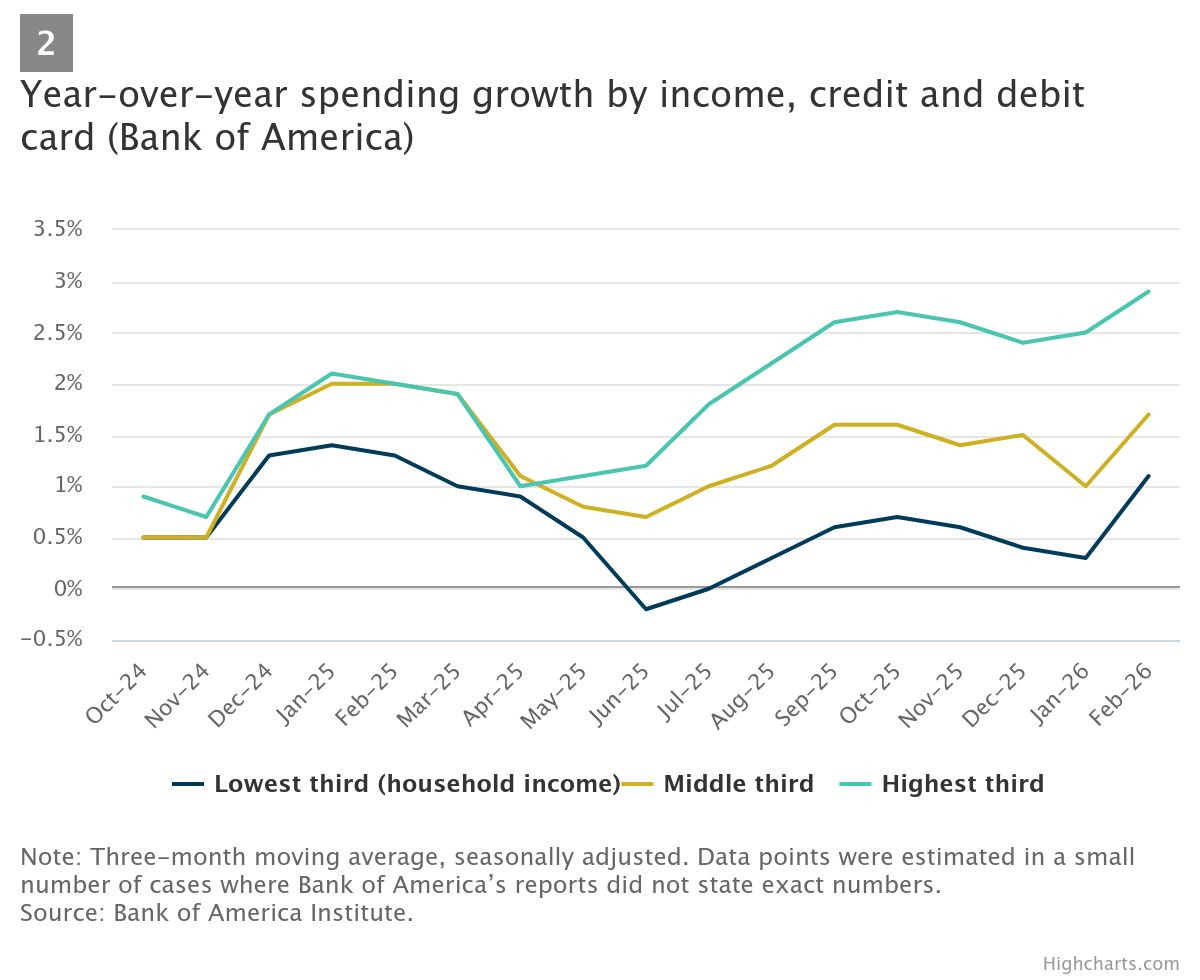
Spending by the lower third of cardholders actually shrunk
in mid-2025 and remained nearly flat until early 2026, when Bank of America
noted a slight narrowing of spending growth gaps in February.
Unlike Moody’s, the Bank of America reports are not
estimates, but a straightforward account of actual spending by households.
However, the view is limited to purchases on credit and debit cards (presumably
missing rent payments and some very large purchases) and the subset of
Americans with cards from one particular bank, which might underrepresent
certain regions of the U.S. and segments of the income spectrum.
Dividing households into thirds makes it hard to compare
directly with Moody’s, which finds most of the action at the very highest
incomes. The Bank of America terciles are roughly comparable, however, to a new
data series from the New York Fed.
New York Fed: A subtle trend, if any
The New York Fed recently rebooted the consumer spending component of its quarterly Economic Heterogeneity
Indicators, including separate measures for retail spending, gas stations, and
groceries. The data come from a panel of 200,000 households surveyed by
Numerator, a market research firm.
Like Bank of America, the New York Fed breaks households
into thirds. Unlike Bank of America, they do not find wide
dispersion in retail spending growth during 2025 (Figure 3; retail spending
excluding cars). Over the five years of available data, the growth rates move in
relative harmony.
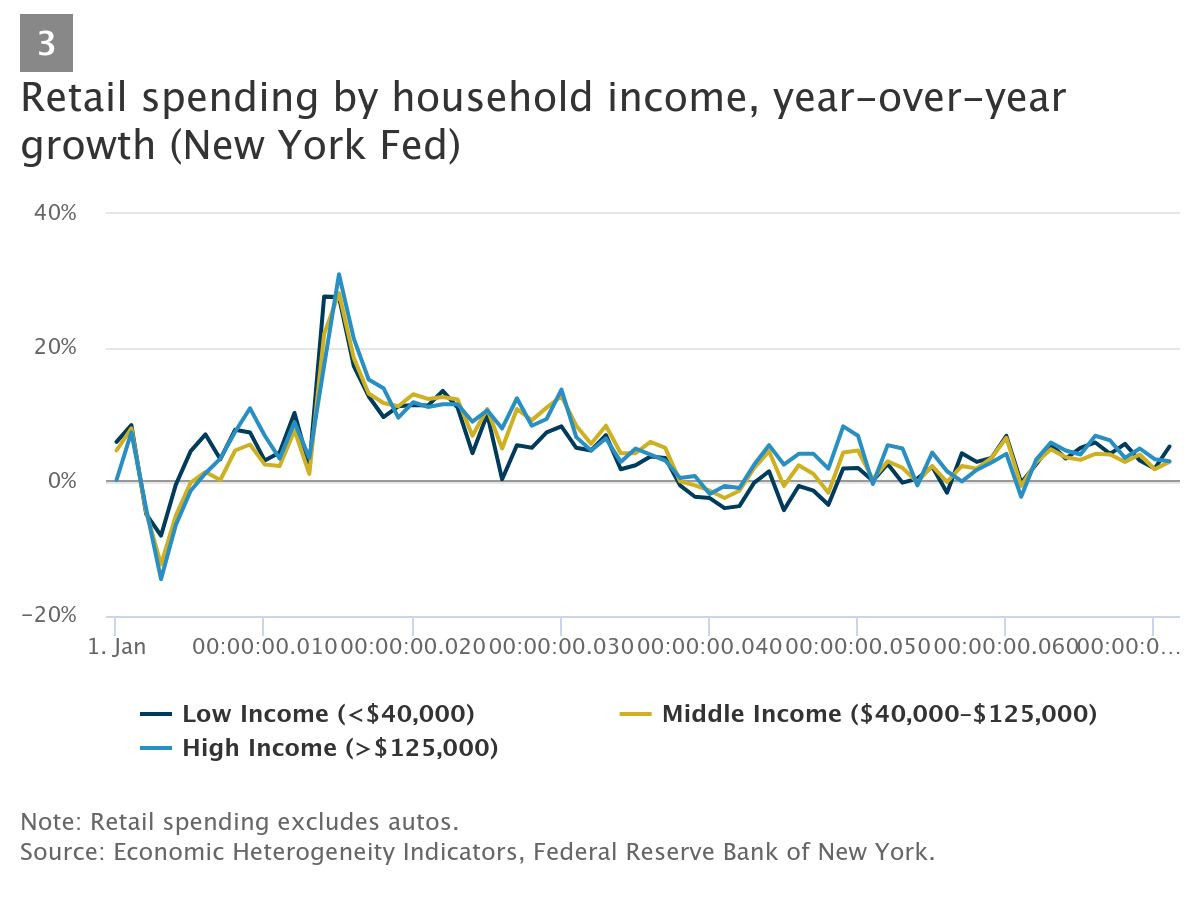
The New York Fed’s results breaking out gas and groceries are similarly bunched through most of those series, although
food and beverage spending growth was notably higher for low-income households in 2025.
If there is a K-shaped trend since the pandemic, it is subtle. Slightly faster spending growth, on average, for
higher- and middle-income households emerges over time as higher
cumulative growth in nominal spending (Figure 4). This cumulative view shows
these gaps widened primarily in 2023 and have been mostly stable since
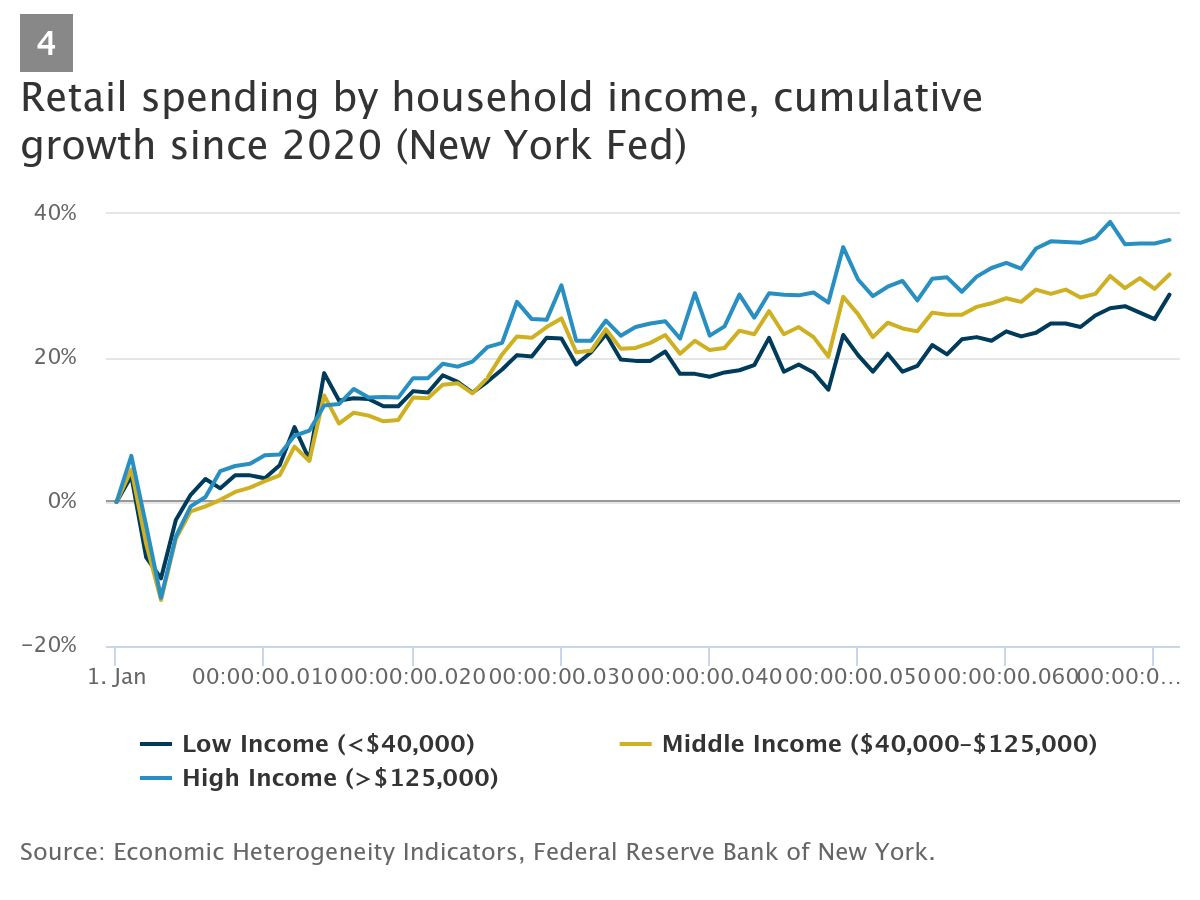
Nominal spending growth since 2020 ranges from 29 percent
for low-income households to 36 percent for high-income ones. This is much less
than the 62 percent nominal growth in personal outlays reported by Moody’s for
top-10-percent households during roughly the same period. Spending growth for
the top, middle, and bottom also remain much more tightly bunched than the
nearly 2-to-1 difference Moody’s reports between these high-income households
and all other groups.
CONT...K-shaped
Another private sector report, Consumer Checkpoint from the Bank of America Institute, began including summaries of spending growth by
income in late 2024. The monthly report provides a near-real-time view, albeit
limited to credit and debit card spending by Bank of America customers.3
While Moody’s pegs a sharp break after 2020, Bank of America
did not observe a widening gap in their data until mid-2025, when a large
separation in spending growth opened between lower-, middle-, and upper-income
customers—arguably more “E” than “K” (Figure 2).
Spending by the lower third of cardholders actually shrunk
in mid-2025 and remained nearly flat until early 2026, when Bank of America
noted a slight narrowing of spending growth gaps in February.
Unlike Moody’s, the Bank of America reports are not
estimates, but a straightforward account of actual spending by households.
However, the view is limited to purchases on credit and debit cards (presumably
missing rent payments and some very large purchases) and the subset of
Americans with cards from one particular bank, which might underrepresent
certain regions of the U.S. and segments of the income spectrum.
Dividing households into thirds makes it hard to compare
directly with Moody’s, which finds most of the action at the very highest
incomes. The Bank of America terciles are roughly comparable, however, to a new
data series from the New York Fed.
New York Fed: A subtle trend, if any
The New York Fed recently rebooted the consumer spending component of its quarterly Economic Heterogeneity
Indicators, including separate measures for retail spending, gas stations, and
groceries. The data come from a panel of 200,000 households surveyed by
Numerator, a market research firm.
Like Bank of America, the New York Fed breaks households
into thirds. Unlike Bank of America, they do not find wide
dispersion in retail spending growth during 2025 (Figure 3; retail spending
excluding cars). Over the five years of available data, the growth rates move in
relative harmony.
The New York Fed’s results breaking out gas and groceries are similarly bunched through most of those series, although
food and beverage spending growth was notably higher for low-income households in 2025.
If there is a K-shaped trend since the pandemic, it is subtle. Slightly faster spending growth, on average, for
higher- and middle-income households emerges over time as higher
cumulative growth in nominal spending (Figure 4). This cumulative view shows
these gaps widened primarily in 2023 and have been mostly stable since
Nominal spending growth since 2020 ranges from 29 percent
for low-income households to 36 percent for high-income ones. This is much less
than the 62 percent nominal growth in personal outlays reported by Moody’s for
top-10-percent households during roughly the same period. Spending growth for
the top, middle, and bottom also remain much more tightly bunched than the
nearly 2-to-1 difference Moody’s reports between these high-income households
and all other groups.
04-05-2026, 05:06 PM
-
#10
- gachase21
- Join Date: Dec 2010
- Location: Georgia, United States
- Posts: 31,767
- Subscribers: 4
- Rep Power: 389233
-
-
Cont...
There will always be a wealth gap- but more people overall are doing fine
unless you stay doom scrolling misery media, and don't walk outside to realize things are fine
Consumer Expenditure Surveys: Lagging data, nothing K-shaped
In the last week of 2025, the U.S. Bureau of Labor Statistics released its Consumer Expenditure Surveys(CE), the annual report on household spending. The CE arrived two months late because of the fall’s federal government shutdown.
Unlike the primary government measure of spending in the U.S. economy, personal consumption expenditures (PCE), the CE is survey-based—and therefore able to report straightforward results by quintiles and deciles of household income.4 However, the CE comes with caveats about what is in (“out of pocket” spending reported by households on goods or services, including rent) and what is out (mortgage and auto loan principal payments; spending on households’ behalf by employers, government, or nonprofits—especially on health care).5The CE has also diverged in recent decades from expenditures captured by the PCE, with the CE-to-PCE ratio declining over time to less than 60 percent today.
The CE’s comprehensive, survey-based approach also comes with a substantial lag: It captures household spending only through the end of 2024. With these various caveats established, the latest CE results offer little support for the conventional wisdom of a consistent, K-shaped pattern in recent years. From 2022 through 2024, as CE spending growth by households slowed overall, the results by income group defy easy summary. But one thing they are not, is K-shaped (Figure 5).
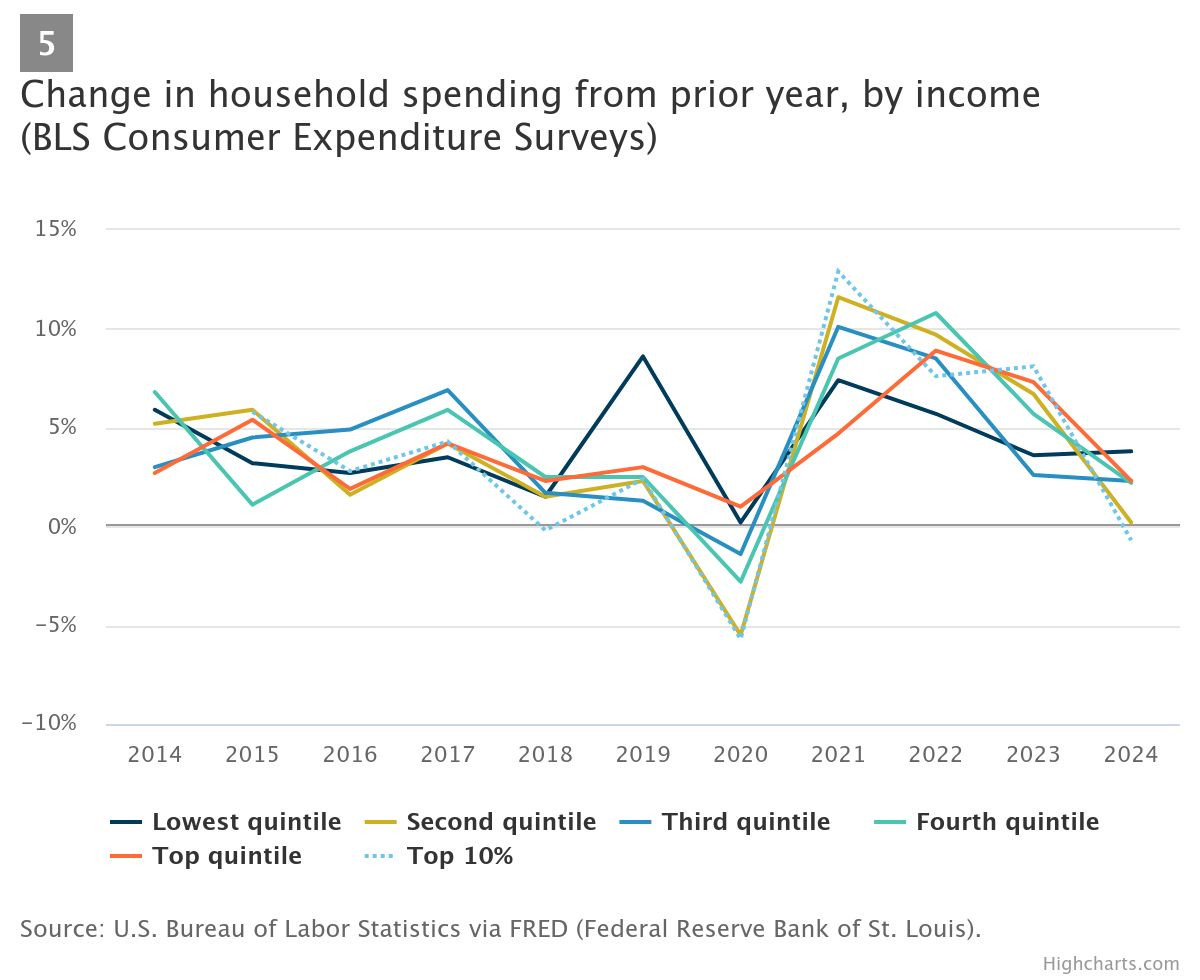
Spending growth by households in the 21st to 40thpercentile of income was notably sluggish in 2024. However, the lowest-income U.S. households in the survey increased their spending nearly 4 percent—more than any other quintile and the only group to have faster spending growth than the prior year.6 Meanwhile, spending growth by the highest-earning households slowed sharply. CE households in the top 10 percent actually spent less in 2024 than the year before (even before adjusting for inflation).The CE confirms high-income households account for a disproportionate share of spending, though much less lopsided than the headline-making numbers from Moody’s. The top 10 percent of households in the CE accounted for 23 percent of spending (Figure 6).
In 2024 the highest-earning 30 percent of households accounted for more than half of out-of-pocket consumer spending in the CE. The bottom half of households by income accounted for less than 30 percent.
CONT...
read://https_www.minneapolisfed.org/?url=https%3A%2F%2Fwww.minneapolisfed.org%2Farticle%2F2026%2Fhave-us-consumers-gone-k-shaped-a-review-of-the-data
In the last week of 2025, the U.S. Bureau of Labor Statistics released its Consumer Expenditure Surveys(CE), the annual report on household spending. The CE arrived two months late because of the fall’s federal government shutdown.
Unlike the primary government measure of spending in the U.S. economy, personal consumption expenditures (PCE), the CE is survey-based—and therefore able to report straightforward results by quintiles and deciles of household income.4 However, the CE comes with caveats about what is in (“out of pocket” spending reported by households on goods or services, including rent) and what is out (mortgage and auto loan principal payments; spending on households’ behalf by employers, government, or nonprofits—especially on health care).5The CE has also diverged in recent decades from expenditures captured by the PCE, with the CE-to-PCE ratio declining over time to less than 60 percent today.
The CE’s comprehensive, survey-based approach also comes with a substantial lag: It captures household spending only through the end of 2024. With these various caveats established, the latest CE results offer little support for the conventional wisdom of a consistent, K-shaped pattern in recent years. From 2022 through 2024, as CE spending growth by households slowed overall, the results by income group defy easy summary. But one thing they are not, is K-shaped (Figure 5).
Spending growth by households in the 21st to 40thpercentile of income was notably sluggish in 2024. However, the lowest-income U.S. households in the survey increased their spending nearly 4 percent—more than any other quintile and the only group to have faster spending growth than the prior year.6 Meanwhile, spending growth by the highest-earning households slowed sharply. CE households in the top 10 percent actually spent less in 2024 than the year before (even before adjusting for inflation).The CE confirms high-income households account for a disproportionate share of spending, though much less lopsided than the headline-making numbers from Moody’s. The top 10 percent of households in the CE accounted for 23 percent of spending (Figure 6).
In 2024 the highest-earning 30 percent of households accounted for more than half of out-of-pocket consumer spending in the CE. The bottom half of households by income accounted for less than 30 percent.
CONT...
There will always be a wealth gap- but more people overall are doing fine
unless you stay doom scrolling misery media, and don't walk outside to realize things are fine
04-05-2026, 05:12 PM
-
#11
- gachase21
- Join Date: Dec 2010
- Location: Georgia, United States
- Posts: 31,767
- Subscribers: 4
- Rep Power: 389233
-
-
Originally Posted By isingm0del⏩
You are just jealous United States is absolutely economically obliterating Europe in every single way -and you can't have a cool guy like we do.
It's quite telling that the three remaining MIGAs here are
Mark1T a bonafide child rape advocate
Gachase who is severely brain damaged IRL and can't tell up from down
Waingro who has never left his mother's basement
Everyone else has actually moved on lol
Absolutely brootal
Mark1T a bonafide child rape advocate
Gachase who is severely brain damaged IRL and can't tell up from down
Waingro who has never left his mother's basement
Everyone else has actually moved on lol
Absolutely brootal
04-05-2026, 05:17 PM
-
#12
04-05-2026, 05:19 PM
-
#13
Originally Posted By gachase21⏩
How the fuck you gonna tell me, clown?
Cont...
read://https_www.minneapolisfed.org/?url=https%3A%2F%2Fwww.minneapolisfed.org%2Farticle%2F2026%2Fhave-us-consumers-gone-k-shaped-a-review-of-the-data
There will always be a wealth gap- but more people overall are doing fine
unless you stay doom scrolling misery media, and don't walk outside to realize things are fine
read://https_www.minneapolisfed.org/?url=https%3A%2F%2Fwww.minneapolisfed.org%2Farticle%2F2026%2Fhave-us-consumers-gone-k-shaped-a-review-of-the-data
There will always be a wealth gap- but more people overall are doing fine
unless you stay doom scrolling misery media, and don't walk outside to realize things are fine
You were trying to lecture me on a business you know nothing about, when I am the subject matter expert here lol.
You were literally trying to make claims electricians are wanted so bad that they are being offered 350k a year LMAO.
If that isn't the most delusional claim I have ever heard I don't know what is.
I've never met one electrician sniffing anywhere near that much money. If they clear 140k that's like a record year for most, and that is with working massive amounts of OT.
Every trade guy I know isn't hammering about how good the economy is. They were just complaining about how piss poor everything is when raises were being allocated. All they do is cry about the price of everything being too high.
You think things are so great? You should see how everybody got fucked on healthcare.
These are things you know nothing about because you're an armchair guy.
I know the trade industry because I work in it.
You manage fast food chains and are ridiculous claims about things you have no idea what you're speaking about besides being armchair guy reading Bloomberg all day from your phone, and posting meaningless charts trying to confuse people.
All that stuff doesn't give any accurate picture of anything.
When I skim through all this stuff it's is all bullshit lies.
All these articles and statistics are just meant to keep confidence in markets.
"I am a rational animal who occupies the intermediary position between angel and beast"
"The upper class is afforded their position by the collective burden the underclass must carry for them"
**Summer Walker Crew**
04-05-2026, 05:24 PM
-
#14
04-05-2026, 05:25 PM
-
#15
Originally Posted By gachase21⏩
Sure you do. Just like you claim to be a doctor, lawyer, fast food worker.
Sorry you're having a hard time in California man -I bet it's pretty tough there.
Yea- i work with trade stuff as well.
Yea- i work with trade stuff as well.
You do it all.
"I am a rational animal who occupies the intermediary position between angel and beast"
"The upper class is afforded their position by the collective burden the underclass must carry for them"
**Summer Walker Crew**
04-05-2026, 05:33 PM
-
#16
- gachase21
- Join Date: Dec 2010
- Location: Georgia, United States
- Posts: 31,767
- Subscribers: 4
- Rep Power: 389233
-
-
Originally Posted By OPGenesis⏩
Work with =contract, purchase, hire labor, vendors etc as well as direct colleges in the business.
Sure you do. Just like you claim to be a doctor, lawyer, fast food worker.
You do it all.
You do it all.
-I never claimed to be a doctor or lawyer- I talked about how I helped my kids study and help them for finals or standardized testing stuff, etc.
Helping them study doesn't mean I am a subject expert. It means I do things to help. Keep them focused, create the environment, get them to supplies, good nutrition, monitor sleep patern, Keep them awake, motivated and on pace.
It is more like being a coach, not a teacher or subject matter expert.
Sometimes that involves reading with them having them read to me screen, sharing to make sure they're staying focused etc...
Read their books also so I can help quiz
Etc
We actually do family study sessions often told each other accountable. (Face time)
Why are you getting so upset?
04-05-2026, 05:57 PM
-
#17
- Stizzel
- Rothbardian
-
- Stizzel
- Rothbardian
- Join Date: Apr 2008
- Location: Your Mom
- Posts: 83,746
- Subscribers: 1
- Rep Power: 384419
-
-
Originally Posted By gachase21⏩
If only people knew they were doing fine
Cont...
read://https_www.minneapolisfed.org/?url=https%3A%2F%2Fwww.minneapolisfed.org%2Farticle%2F2026%2Fhave-us-consumers-gone-k-shaped-a-review-of-the-data
There will always be a wealth gap- but more people overall are doing fine
unless you stay doom scrolling misery media, and don't walk outside to realize things are fine
read://https_www.minneapolisfed.org/?url=https%3A%2F%2Fwww.minneapolisfed.org%2Farticle%2F2026%2Fhave-us-consumers-gone-k-shaped-a-review-of-the-data
There will always be a wealth gap- but more people overall are doing fine
unless you stay doom scrolling misery media, and don't walk outside to realize things are fine
“It’s the bill of rights, not the bill of requests. Rights are not up for negotiations.” Thomas Massie, MAGA enemy #1
04-05-2026, 06:38 PM
-
#18
- Waingro
- Christian Scientist
-

- Waingro
- Christian Scientist
- Join Date: Nov 2016
- Posts: 2,277
- Subscribers: 2
- Rep Power: 2306
-
-
Originally Posted By Stizzel⏩
The economy is so bad, all of Trump's haters are full of GLEE at any piece of bad economic data. And the good economic data gets dismissed. People are struggling bigly
Yes keep telling the plebs how great the economy is and if they're struggling they must be stupid. I cant imagine how this could backfire
04-05-2026, 07:02 PM
-
#19
- gachase21
- Join Date: Dec 2010
- Location: Georgia, United States
- Posts: 31,767
- Subscribers: 4
- Rep Power: 389233
-
-
Originally Posted By Waingro⏩
The doom and misery media world is pretty powerfully right now.
The economy is so bad, all of Trump's haters are full of GLEE at any piece of bad economic data. And the good economic data gets dismissed. People are struggling bigly
It's astonishing when otherwise smart people fall for it.
I have a dude I know who lives down the road from me like that- 5 acre nice house, high income, paid off new cars, etc etc - and I meet up with him on walks, he talks about how auful things are- lol dude you srs- I try to ask him real life examples on how, and nada.
He's got caught in the doom scroll feed of naysayers and just eating the BS up.
OPgenesis's debatably inaccurate post earlier does make a good point about something.
-If you are ambitious, things are awesome for you right now- really really good. You are ballin and spending.
-If you are an unmotivated lazy ass- you are probably miserable.
I have no problem with that.
04-05-2026, 10:29 PM
-
#20

Originally Posted By isingm0del⏩
LOL’d hard. Accurate as fuck too
It's quite telling that the three remaining MIGAs here are
Mark1T a bonafide child rape advocate
Gachase who is severely brain damaged IRL and can't tell up from down
Waingro who has never left his mother's basement
Everyone else has actually moved on lol
Absolutely brootal
Mark1T a bonafide child rape advocate
Gachase who is severely brain damaged IRL and can't tell up from down
Waingro who has never left his mother's basement
Everyone else has actually moved on lol
Absolutely brootal
04-06-2026, 01:54 AM
-
#21
- gachase21
- Join Date: Dec 2010
- Location: Georgia, United States
- Posts: 31,767
- Subscribers: 4
- Rep Power: 389233
-
-
Originally Posted By PhilNine⏩
Honestly was kinda surprised ising went personal with me like that.
LOL’d hard. Accurate as fuck too
We disagree, but I had always thought we had a decent relationship.
I guess I had incorrectly assumed a higher level of character there. Idk.
04-06-2026, 05:38 AM
-
#22

- NitrogenWidget
- Join Date: Dec 2010
- Location: United States
- Posts: 43,261
- Subscribers: 1
- Rep Power: 349299
-
-
Originally Posted By gachase21⏩
I live in NY.
The doom and misery media world is pretty powerfully right now.
It's astonishing when otherwise smart people fall for it.
I have a dude I know who lives down the road from me like that- 5 acre nice house, high income, paid off new cars, etc etc - and I meet up with him on walks, he talks about how auful things are- lol dude you srs- I try to ask him real life examples on how, and nada.
He's got caught in the doom scroll feed of naysayers and just eating the BS up.
OPgenesis's debatably inaccurate post earlier does make a good point about something.
-If you are ambitious, things are awesome for you right now- really really good. You are ballin and spending.
-If you are an unmotivated lazy ass- you are probably miserable.
I have no problem with that.
It's astonishing when otherwise smart people fall for it.
I have a dude I know who lives down the road from me like that- 5 acre nice house, high income, paid off new cars, etc etc - and I meet up with him on walks, he talks about how auful things are- lol dude you srs- I try to ask him real life examples on how, and nada.
He's got caught in the doom scroll feed of naysayers and just eating the BS up.
OPgenesis's debatably inaccurate post earlier does make a good point about something.
-If you are ambitious, things are awesome for you right now- really really good. You are ballin and spending.
-If you are an unmotivated lazy ass- you are probably miserable.
I have no problem with that.
if anything is a detriment to quality of life to the average person here it is the policies the dems in charge have put in place.
04-06-2026, 05:39 AM
-
#23
- NitrogenWidget
- Join Date: Dec 2010
- Location: United States
- Posts: 43,261
- Subscribers: 1
- Rep Power: 349299
-
-
Originally Posted By gachase21⏩
i negged him red for that uglyness.
Honestly was kinda surprised ising went personal with me like that.
We disagree, but I had always thought we had a decent relationship.
I guess I had incorrectly assumed a higher level of character there. Idk.
We disagree, but I had always thought we had a decent relationship.
I guess I had incorrectly assumed a higher level of character there. Idk.
it was satisfying.
white knight out.
Bookmarks
-

- Digg
-

- del.icio.us
-

- StumbleUpon
-

-

Posting Permissions
- You may not post new threads
- You may not post replies
- You may not post attachments
- You may not edit your posts