
Forum
»
 Gachase21, my dear frenemy
Gachase21, my dear frenemy
- Results 1 to 7 of 7
-
Page 1 of 1
Thread:
Gachase21, my dear frenemy
 05-11-2026, 08:12 PM
-
#1


Gachase21, my dear frenemy
Cheers, m8.
"I am a rational animal who occupies the intermediary position between angel and beast"
"The upper class is afforded their position by the collective burden the underclass must carry for them"
**Summer Walker Crew**
05-11-2026, 08:15 PM
-
#2
 05-11-2026, 09:06 PM
-
#3
- Bonobo
- Autist Whisperer
-

- Bonobo
- Autist Whisperer
- Join Date: Jan, 2026
- Location: Uganda
- Height: 6'1"
- Weight: 232 lbs
- Posts: 7,535
- Subscribers: 3
- Rep Power: 118674
-
-

Originally Posted By Waingro⏩
I don't even think your fellow MAGAs who post here would support your claim of intellectually mogging anyone.
He mogs you intellectually. As do I
El Bonobo
Incel crusher
05-13-2026, 09:27 AM
-
#4

- gachase21
- Join Date: Dec 2010
- Location: Georgia, United States
- Posts: 31,767
- Subscribers: 4
- Rep Power: 389233
-
-
Been busy with kids finals (and sons graduation) op- haven't been here much.
I did take a moment a while back when rikters returned to make a thread shortly after designed specifically to draw and trigger you (manufacturing related) just for old times sake (it worked even though you know better:) )
So don't think I've forgotten about you, or intentionally neglected you....
Anyway- how are things going for you? Kid good? You gonna get out of cali?
Are you enjoying how things are going economically :) ?
Consumers are still healthy overall.
-Real volume is growing, card spending is hitting multi-year highs (even ex-gas), freight is moving more goods, inventories aren’t piling up (movement), and the labor market is stable.
-Yes, there’s a clear K-shape (higher-income powering ahead while lower/middle feel the pinch on discretionary), and shelter/groceries/gas are real pain points.
But the hard numbers on quantities consumed and physical movement of goods not only show no doom collapse coming - it even shows optimism:)
I.e
-Real PCE
March 2026 data ( released April 30)
• Real PCE +0.2% MoM (+$39.6 billion) — quantities of goods and services bought still rose after stripping out prices.
• Nominal PCE +0.9% mom
• PCE prices +0.7% mom / +3.5% yoy
Personal income and disposable income both +0.6% that month. Saving rate dipped to 3.6% but saving dollars still totaled $857.3 billion https://www.bea.gov/news/2026/personal-income-and-outlays-march-2026
-BOA card data ( May 12 report)
• Total credit + debit card spending per household: +4.8% yoy — strongest monthly gain in three years.
• Excluding gasoline: +4.0% yoy — fastest ex-gas pace in three years.
• By income group: Lower-income still +3.1% yoy (still positive and improved from March), Middle +3.6% yoy, Higher +4.9% yoy.
• Transaction volumes (unit-level) remained positive in restaurants, general merchandise, and travel. Discretionary spending slowed modestly for lower/middle-income (but still moving up) and higher-income kept ramping it up — yea K-shape, yet no lower end collapse.
Gas prices did add some headline noise, but the underlying strength (especially ex-gas) is clear.
https://institute.bankofamerica.com/economic-insights/consumer-checkpoint-may-2026.html
Full PDF: https://institute.bankofamerica.com/content/dam/economic-insights/consumer-checkpoint-may-2026.pdf
-Retail Sales ( April 21 report)
• +1.7% mom (beat expectations), +4.0% yoy
• Retail trade +1.9% mom / +4.2% yoy.
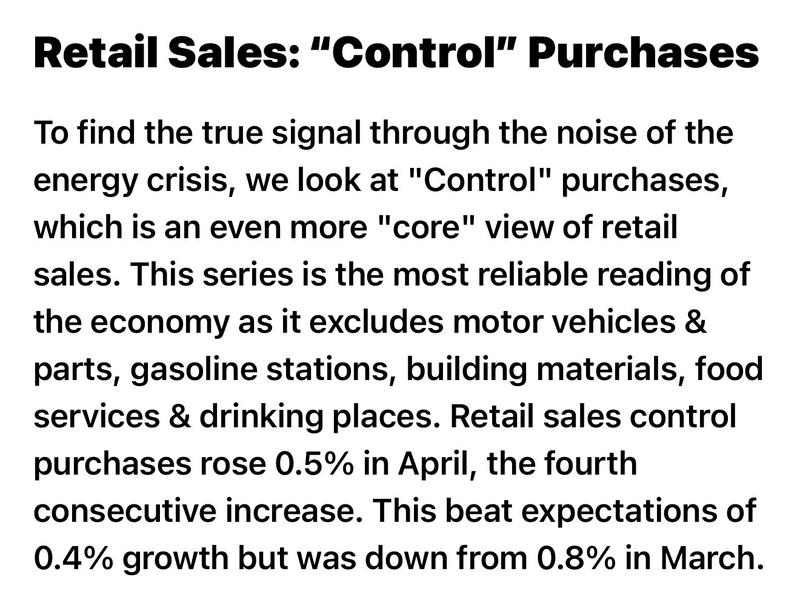
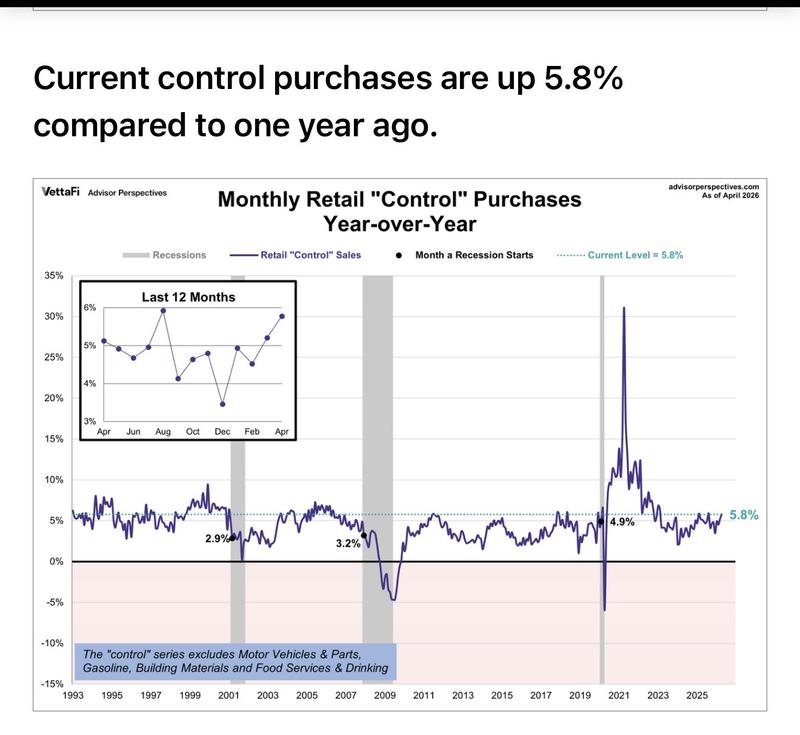
• Core control group (ex-auto & gas): +0.7% mom (beat +0.2% expectations).
Broad gains across vehicles, furniture, electronics, building materials, food/beverage, health care, general merchandise, and nonstore retailers — even with gas stations surging +15.5% MoM from Iran-related price spikes.
https://www.census.gov/retail/sales.html
And what I like to measure the most real physical volume indiators (freight & inventories — the stuff that actually moves)
ATA truck tonnage index (March 2026) +0.3% MoM / +3% YoY — largest year-over-year gain since October 2022.
Q1 2026 total +2.1% YoY. (Trucks move 70% of U.S. freight tonnage — this is pure volume, not dollars.)
-Rail Traffic (week ending May 2, 2026): U.S. rail traffic +3.9% YoY overall; recent weeks showing 3-4% gains in carloads and intermodal.
Business Inventories (latest data): +0.4% mom / +1.3% yoy, but inventories/sales ratio fell to 1.33 (which means goods are moving through the system, not piling up unsold).
If volume were cratering, you’d see truck/rail tonnage collapsing and warehouses overflowing.
The opposite is happening.
ATA: https://www.trucking.org/news-insights/ata-truck-tonnage-index-edged-03-higher-march
AAR Rail: https://www.aar.org/news/aar-reports-weekly-rail-traffic-for-the-week-ending-may-2-2026/
Census Inventories:
https://www.census.gov/mtis/www/data/pdf/mtis_current.pdf
Cont...
I did take a moment a while back when rikters returned to make a thread shortly after designed specifically to draw and trigger you (manufacturing related) just for old times sake (it worked even though you know better:) )
So don't think I've forgotten about you, or intentionally neglected you....
Anyway- how are things going for you? Kid good? You gonna get out of cali?
Are you enjoying how things are going economically :) ?
Consumers are still healthy overall.
-Real volume is growing, card spending is hitting multi-year highs (even ex-gas), freight is moving more goods, inventories aren’t piling up (movement), and the labor market is stable.
-Yes, there’s a clear K-shape (higher-income powering ahead while lower/middle feel the pinch on discretionary), and shelter/groceries/gas are real pain points.
But the hard numbers on quantities consumed and physical movement of goods not only show no doom collapse coming - it even shows optimism:)
I.e
-Real PCE
March 2026 data ( released April 30)
• Real PCE +0.2% MoM (+$39.6 billion) — quantities of goods and services bought still rose after stripping out prices.
• Nominal PCE +0.9% mom
• PCE prices +0.7% mom / +3.5% yoy
Personal income and disposable income both +0.6% that month. Saving rate dipped to 3.6% but saving dollars still totaled $857.3 billion https://www.bea.gov/news/2026/personal-income-and-outlays-march-2026
-BOA card data ( May 12 report)
• Total credit + debit card spending per household: +4.8% yoy — strongest monthly gain in three years.
• Excluding gasoline: +4.0% yoy — fastest ex-gas pace in three years.
• By income group: Lower-income still +3.1% yoy (still positive and improved from March), Middle +3.6% yoy, Higher +4.9% yoy.
• Transaction volumes (unit-level) remained positive in restaurants, general merchandise, and travel. Discretionary spending slowed modestly for lower/middle-income (but still moving up) and higher-income kept ramping it up — yea K-shape, yet no lower end collapse.
Gas prices did add some headline noise, but the underlying strength (especially ex-gas) is clear.
https://institute.bankofamerica.com/economic-insights/consumer-checkpoint-may-2026.html
Full PDF: https://institute.bankofamerica.com/content/dam/economic-insights/consumer-checkpoint-may-2026.pdf
-Retail Sales ( April 21 report)
• +1.7% mom (beat expectations), +4.0% yoy
• Retail trade +1.9% mom / +4.2% yoy.
• Core control group (ex-auto & gas): +0.7% mom (beat +0.2% expectations).
Broad gains across vehicles, furniture, electronics, building materials, food/beverage, health care, general merchandise, and nonstore retailers — even with gas stations surging +15.5% MoM from Iran-related price spikes.
https://www.census.gov/retail/sales.html
And what I like to measure the most real physical volume indiators (freight & inventories — the stuff that actually moves)
ATA truck tonnage index (March 2026) +0.3% MoM / +3% YoY — largest year-over-year gain since October 2022.
Q1 2026 total +2.1% YoY. (Trucks move 70% of U.S. freight tonnage — this is pure volume, not dollars.)
-Rail Traffic (week ending May 2, 2026): U.S. rail traffic +3.9% YoY overall; recent weeks showing 3-4% gains in carloads and intermodal.
Business Inventories (latest data): +0.4% mom / +1.3% yoy, but inventories/sales ratio fell to 1.33 (which means goods are moving through the system, not piling up unsold).
If volume were cratering, you’d see truck/rail tonnage collapsing and warehouses overflowing.
The opposite is happening.
ATA: https://www.trucking.org/news-insights/ata-truck-tonnage-index-edged-03-higher-march
AAR Rail: https://www.aar.org/news/aar-reports-weekly-rail-traffic-for-the-week-ending-may-2-2026/
Census Inventories:
https://www.census.gov/mtis/www/data/pdf/mtis_current.pdf
Cont...
05-13-2026, 09:27 AM
-
#5
- gachase21
- Join Date: Dec 2010
- Location: Georgia, United States
- Posts: 31,767
- Subscribers: 4
- Rep Power: 389233
-
-
Labor market
Recent jobs report
• Private-sector payrolls: +123,000 jobs — this drove virtually all the growth.
• Government sector: –8,000 jobs (federal government –9,000; federal employment now down 348,000 or 11.5% since its October 2024 peak).
• Wages (private nonfarm payrolls): Average hourly earnings rose +0.2% momto $37.41 (+3.6% yoy).
And with a much lower breakevn employment level due to reduced immigration now skewing the participation rate
https://www.dallasfed.org/research/economics/2026/0331
That net job gains are actually much higher compared to relative above break even prior to 2025
Wages indeed didn't best inflation for the first time in a while - but that was skewed highly with government wages- Private sector job gains and wage growth continue to support consumer spending power even as government payrolls shrink.
https://www.bls.gov/news.release/empsit.nr0.htm
Seems the consumer isn’t “spending more for less” in a collapsing volume sense.
Real PCE is positive, card spending (especially ex-gas) is accelerating, freight is stronger, inventories are under control, and the private sector labor market is delivering steady gains and wage increases.
There’s some real short term pain — shelter costs, groceries, gas spikes, and the uneven K-shape recovery hit lower/middle-income households harder on discretionary stuff.(still up)
macro volume, spending, and private-job data paint a picture of continued resilience :)
And companies are seeing this reality in actual earnings :)

Are you seeing this resilience in in cali?
Or does the day to day feel worse for you?
I’ll update if anything big changes :)
Recent jobs report
• Private-sector payrolls: +123,000 jobs — this drove virtually all the growth.
• Government sector: –8,000 jobs (federal government –9,000; federal employment now down 348,000 or 11.5% since its October 2024 peak).
• Wages (private nonfarm payrolls): Average hourly earnings rose +0.2% momto $37.41 (+3.6% yoy).
And with a much lower breakevn employment level due to reduced immigration now skewing the participation rate
https://www.dallasfed.org/research/economics/2026/0331
That net job gains are actually much higher compared to relative above break even prior to 2025
Wages indeed didn't best inflation for the first time in a while - but that was skewed highly with government wages- Private sector job gains and wage growth continue to support consumer spending power even as government payrolls shrink.
https://www.bls.gov/news.release/empsit.nr0.htm
Seems the consumer isn’t “spending more for less” in a collapsing volume sense.
Real PCE is positive, card spending (especially ex-gas) is accelerating, freight is stronger, inventories are under control, and the private sector labor market is delivering steady gains and wage increases.
There’s some real short term pain — shelter costs, groceries, gas spikes, and the uneven K-shape recovery hit lower/middle-income households harder on discretionary stuff.(still up)
macro volume, spending, and private-job data paint a picture of continued resilience :)
And companies are seeing this reality in actual earnings :)
Are you seeing this resilience in in cali?
Or does the day to day feel worse for you?
I’ll update if anything big changes :)
05-15-2026, 06:32 AM
-
#6
 05-15-2026, 07:56 AM
-
#7

Originally Posted By gachase21⏩
Buried in all the graphs is the little blurb about the things that matter most to the average knucklehead.
There’s some real short term pain — shelter costs, groceries, gas spikes, and the uneven K-shape recovery hit lower/middle-income households harder on discretionary stuff.(still up)
Who's side are you on, man?
Bookmarks
-

- Digg
-

- del.icio.us
-

- StumbleUpon
-

-

Posting Permissions
- You may not post new threads
- You may not post replies
- You may not post attachments
- You may not edit your posts